Open Source · Hardware
Zigbee2MQTT Doctor
Diagnose your Zigbee network without installing anything.
Visit Zigbee2MQTT Doctor →The Problem
Zigbee2MQTT is excellent software with a painful debugging experience. When devices go offline or the coordinator misbehaves, diagnosing the problem means parsing log files and grepping through MQTT topics. There was no visual, actionable view of network health.
The Solution
Connect your Zigbee2MQTT broker URL in the browser and get an instant dashboard: signal strength bars for every device, red flags for offline nodes, coordinator status, and a live log stream with filtering. Runs entirely client-side, connects directly to your MQTT broker.
A browser-based diagnostic dashboard for Zigbee2MQTT. See LQI signal strength, offline devices, coordinator health, and live log output — no install needed.
In action
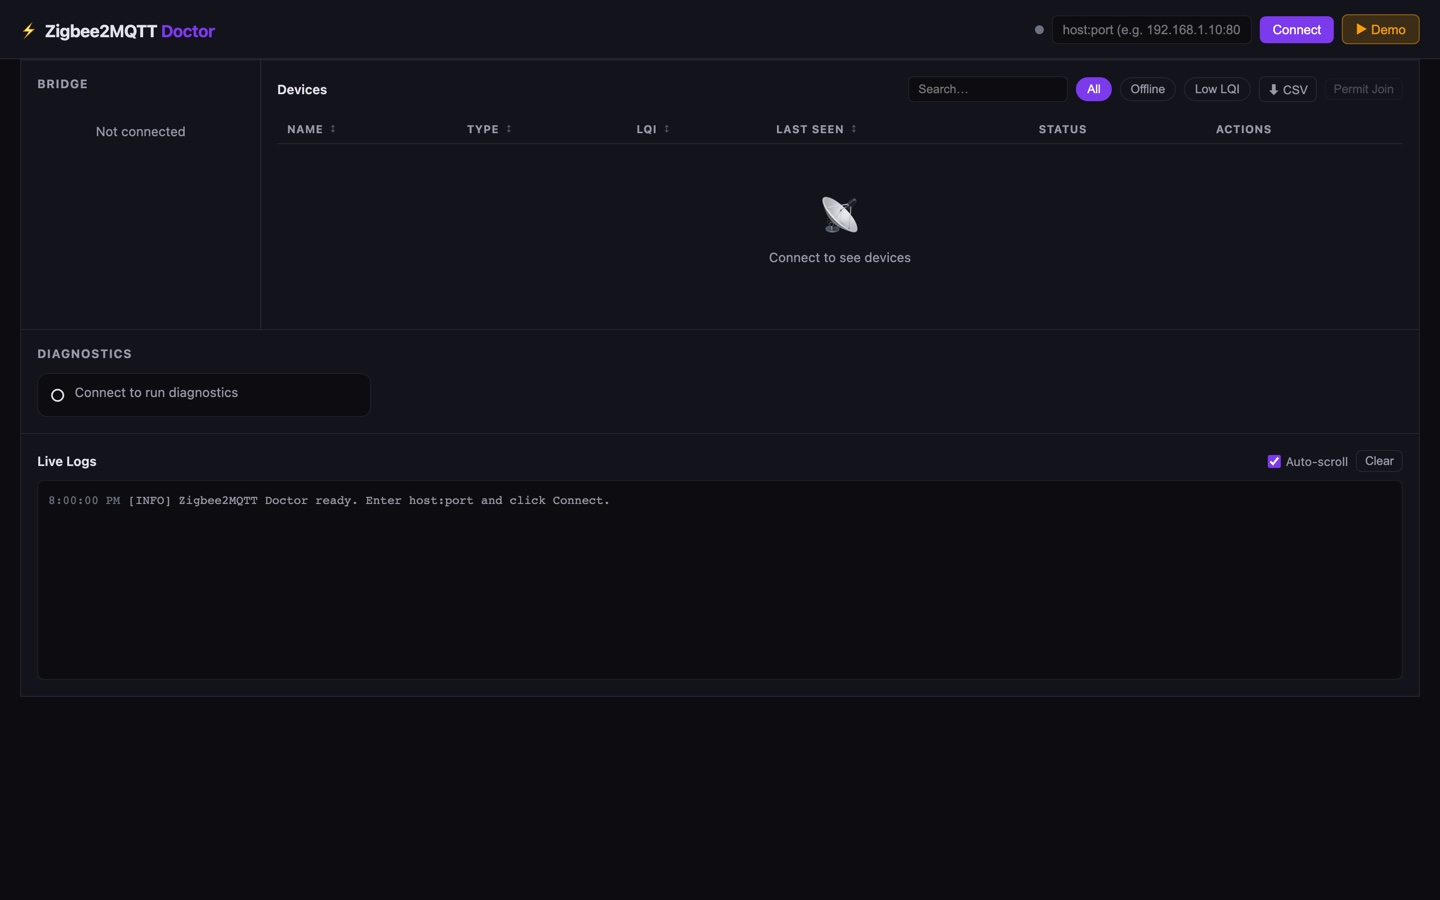
What it does
- LQI signal strength bars for all paired devices
- Offline device detection and alerts
- Coordinator health status
- Live log stream with keyword filtering
- CSV export of device status
- No install — runs in the browser via WebSocket